
On a clear day, you used to be able to see forever
The natural visual range in the United States varies from about 140 miles in western states to 90 miles in eastern states. However, emissions generated by human activity have greatly reduced these historical vistas. In the West, average visibility is now only 33 to 90 miles, with even more significant reductions in the East, where average visibility is just 14 to 24 miles.
The haze that affects this visual range is caused by tiny pollution particles in the air that absorb and scatter sunlight, reducing the clarity and color of what we see. Some of these particles originate from natural sources, such as wildfires and windblown dust. But most are emitted into the air from a diverse and widespread array of human activities.

Regional Haze Rule
In 1999, in an effort to control particle emissions that degrade visibility in the country’s Class 1 national parks and wilderness areas, the U.S. EPA issued a set of regulations commonly referred to as the “Regional Haze Rule.” These regulations mandated that states monitor visibility in their Class 1 areas and create plans to return visibility to natural conditions by the year 2064.
The rule calls on states to use the IMPROVE network to:
- establish baseline visibility at each Class 1 area by monitoring air particulate matter for five years from 2000 through 2004, and
- track progress against the baseline in 5-year increments.
In the five years following adoption of the haze rule, AQRC was called on to install 90 new aerosol samplers, expanding the IMPROVE network from 80 sites in 1999, to 170 sites in 2005, thereby providing data to represent air quality in Class I areas nationwide.
Visibility is improving
Under the Regional Haze Rule, trends in visibility are determined by comparing year-to-year IMPROVE data at each site for the 20th percentile haziest and 20th percentile clearest days of the year (73 clear days and 73 hazy days).
Using these IMPROVE data to compile its most recent assessment of long-term visibility trends in national parks(1), the National Park Service found that from 1999 to 2008, visibility in all but five of the 157 reporting parks had either improved or not degraded.
The five parks with a statistically significant worsening trend for the haziest days were Hawaii Volcanoes National Park and four parks in the Virgin Islands. Another 49 parks showed a statistically significant improvement in visibility on the clearest days, including Yellowstone, Acadia, Great Basin and Great Smoky Mountains national parks.
Air quality is expected to improve more quickly in the future, the NPS states in the report, thanks to regulations aimed at reducing exhaust emissions from motor vehicles and pollution from electric-generating facilities that will be going into full force in coming years.
(1) Air Quality in National Parks: 2009 Annual Performance & Progress Report
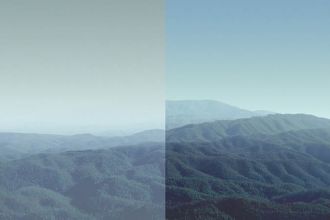

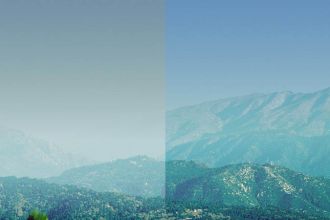
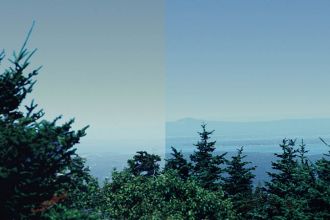
The images above were generated using WinHaze software to show the improvement from 1990 to 2010 in average visibility of the haziest 20 percent of days at each site: clockwise from top left: Great Smoky Mountains NP (North Carolina & Tennessee), Boundary Waters Canoe Area Wilderness (1992-2010) (Minnesota), Acadia NP (Maine), San Gorgonio Wilderness (Calif). Credit: Jenny Hand